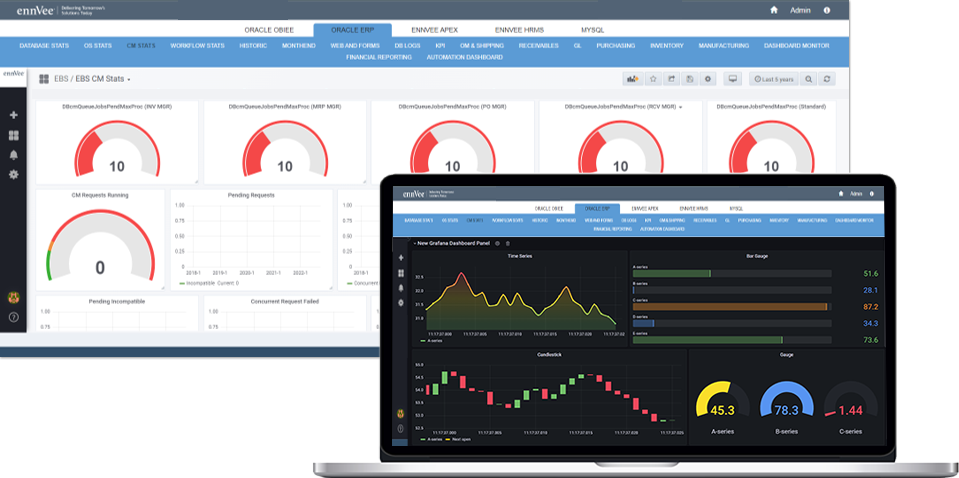
TrendZ simplifies performance monitoring by historically displaying your systems data and KPIs on a centralized dashboard, and automating daily maintenance and troubleshooting work, so you can seamlessly identify and resolve issues before your end users report them.
DBA and IT development analytics are displayed through a simplified presentation layer, where DBAs and Administrators can drill down into database, storage, hardware, and infrastructure metrics for RCA and capacity planning insights.
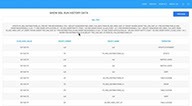
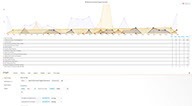
The Historical Data dashboard trends your systems’ performance over the past 90 days. Insights like database growth, user activity, concurrent requests, and CPU usage help Level 3 support teams make proactive adjustments with less effort and guesswork.
TrendZ eliminates the manual effort involved in checking each log for errors by automatically monitoring each log file and alerting when an error is found. TrendZ monitors Apache, HTTP, Alert, WebLogic, and Oracle Access Manager (OAM) logs.
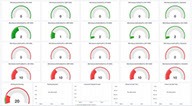
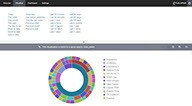
The Application Concurrency Monitoring dashboard shows all queues and programs that are up and running. TrendZ also highlights all concurrent request details and lets you drill down by request ID, request name, who submitted it, how long each request took to run, requests type count, requests status, and requests by runtime.
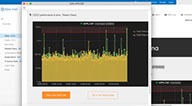
TrendZ provides a built-in tuning advisor that shows you how a performance issue can be fixed with full detection and live tuning. Your SQL logs, run history, execution plans, SIDs, and remediation lifecycle data is consolidated into one dashboard where you can track active sessions running in the database.
You can create custom alerts based on your own metrics and KPIs. The process is simple — create a name for the alert, how often you want it to be checked, add your conditions, and TrendZ will automatically alert you when the conditions are met. Alerts can be sent via email, text message/SMS, service desk, or ticketing system, and point you directly to the location of the issue.
TrendZ monitors all critical programs, business activities, or KPIs custom to your month end, period close, and year end process. You can drill down to see how your month end occurs and rapidly identify and tune programs with performance issues before they impact your users.
TrendZ provides a built-in tuning advisor that shows you how a performance issue can be fixed with full detection and live tuning. Your SQL logs, run history, execution plans, SIDs, and remediation lifecycle data is consolidated into one dashboard where you can track active sessions running in the database.
Connect With Us To Learn More
Connect and explore how we can assist your organization in making informed technology decisions. Share your requirements, and our experts will provide tailored guidance promptly.